TEAM
Darwin
RESPONSIBILITY
• Define problem + research questions
• Find and collect raw data
• Query [SQL] + clean data [Excel; Pivot Table]
• Analysis + Data Visualization [Excel]
OBJECTIVE
Look at Target Group [Income: $15,000–$24,999, and Age: 45–54] similar to caregiver demographic according to PHI National 2018 Report on US Home Care Worker: Key Facts [Median Income: $15,100, Median Age: 47][1] from public data to see how they fare in behavioral and health risk.
BACKGROUND
Caregiving is difficult and often taxing to their mental and physical health. To ensure that our caregivers’ well-being are taken care of, we provide health benefits to those who are eligible. Part of the health benefits we offer include programs that encourages preventive healthcare activities. As an organization who provide and manage health benefits for the caregivers it’s important to ask:
“What are the behaviors of target group similar to caregivers in preventive healthcare activities and which existing or non-existing programs to invest more in to achieve best results?”
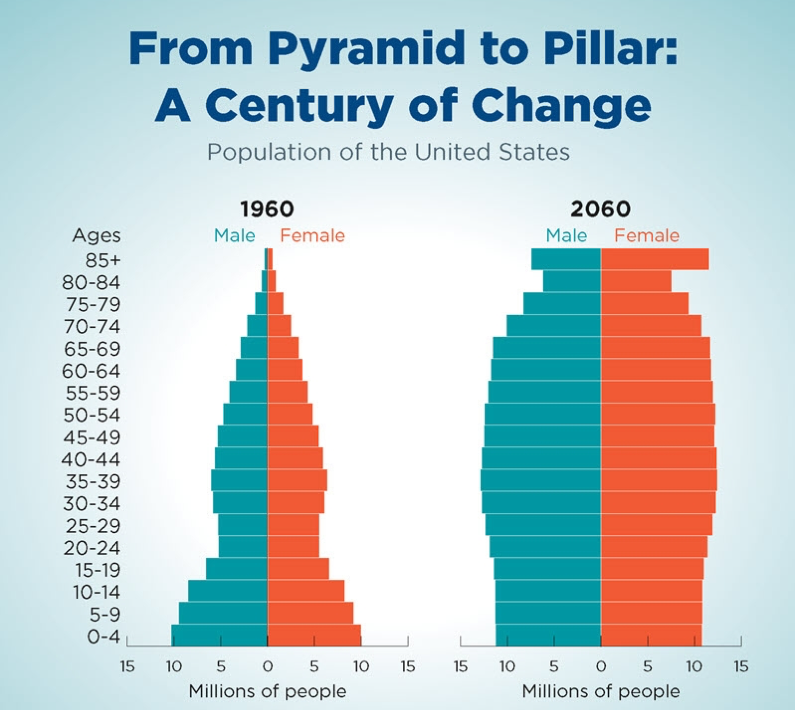
Caregiving is an important field of work in the future. Demands for caregiving work will continually grow—Bureau of Labor Statistics 1 estimated that from 2016–2026, caregiving work will be projected to grow about 41%, which is significantly higher than the average job growth for all occupations (7%)! Yet, caregiving faces unique “natural” challenge in the shifting demographic. Consider this fact: “By 2030, all baby boomers will be older than age 65. This will expand the size of the older population so that 1 in every 5 residents will be retirement age.”2
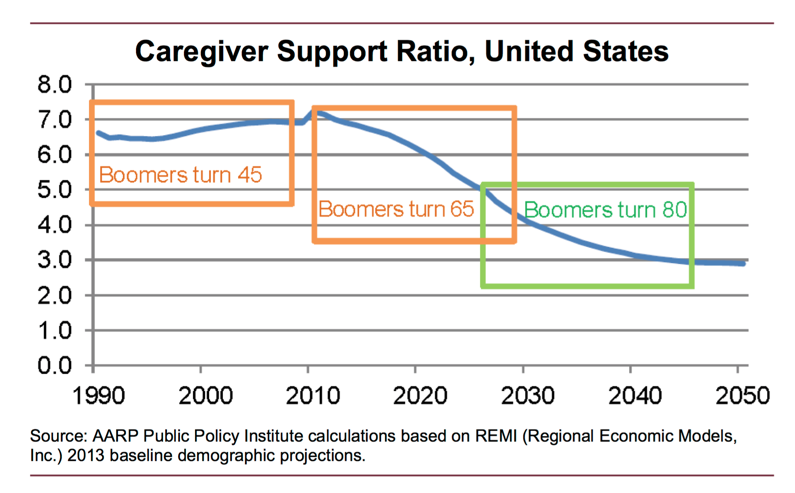
Facing such realities, it logically follows that growing older population size will need more support, but the supply of high-quality and professional caregiving labor cannot keep up with the demand for it. According to AARP Public Policy report, “In 2010, the caregiver support ratio was more than 7 potential caregivers for every person in the high-risk years of 80-plus” and “by 2030, the ratio is projected to decline sharply to 4 to 1; and it is expected to further fall to less than 3 to 1 in 2050, when all boomers will be in the high-risk years of late life.” 3
1. Home Health Aides and Personal Care Aides, Occupational Outlook Handbook. U.S. Bureau of Labor Statistics,” 2019
2. census.gov , “Older People Projected to Outnumber Children for First Time in U.S. History”, 2018.
3. Donald Redfoot, Lynn Feinberg, and Ari. Houser AARP Public Policy Institute, 2013.
DATA COLLECTION + DISCOVERY
1. BRFSS (2010 and Prior, 550MB):
https://chronicdata.cdc.gov/Behavioral-Risk-Factors/Behavioral-Risk-Factor-Surveillance-System-BRFSS-P/y4ft-s73h
2. BRFSS (2011 to Present, 450MB):
https://chronicdata.cdc.gov/Behavioral-Risk-Factors/Behavioral-Risk-Factor-Surveillance-System-BRFSS-P/dttw-5yxu
RESEARCH QUESTIONS
1. What is the top prevalent preventive healthcare behaviors in WA in 2017 of the target group?
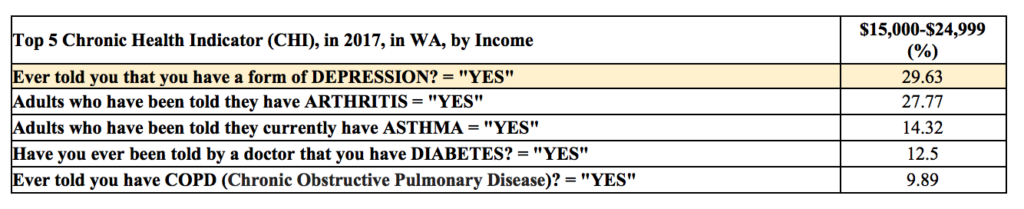
2. What is the top prevalent chronic health risk in WA in 2017 of the target group?
3. Does Health Care Coverage correlate to Health Status (or Chronic Health Risk) in WA target group?
DATA EXPLORATION + QUERY
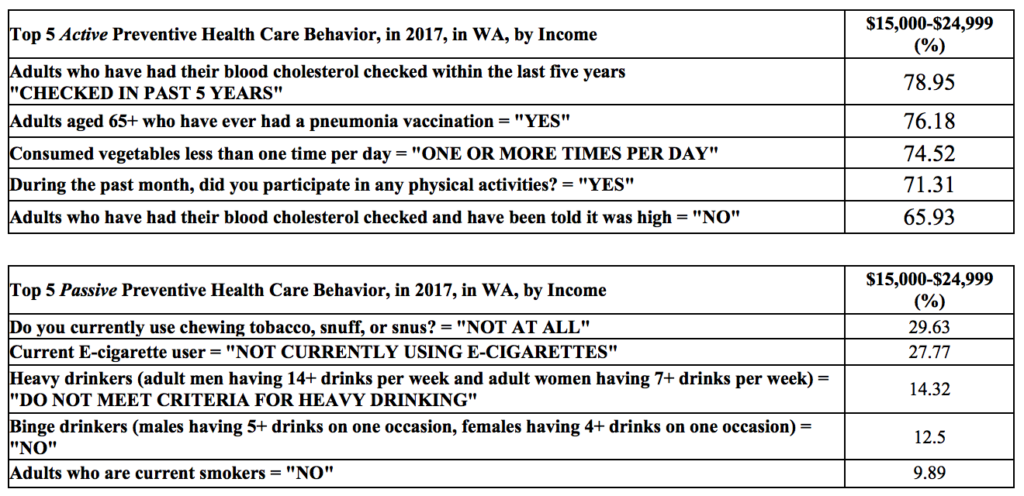
Analysis #1, Top prevalent preventive healthcare
The preventive health care behaviors consists of various kind. Since, there is no “Preventive Health Care” category, I created the category to include different classes that I think falls under general preventive care behaviors, namely, activities that intend to improve physical well-being such as alcohol consumption, etc., as mentioned above [Section V.4.e]. I further categorize each “Class” into “Types”—Active and Passive. The purpose is to further clarify activities that are “promoting behaviors that relate to healthy outcome,” Active, and “avoiding/ceasing behaviors that relate to unhealthy outcome,” Passive. Example:
(1) Participated in muscle strengthening exercises… → Active
(2) Smoking status… → Passive
The top Active Preventive Health Care Behavior is actually “Seatbelt Use” (95.52%), which is a subgroup of the “Injury” class. However, for this data analysis, while injury is an important topic, I will not include “Seatbelt Use” because it does not relate to health insurance coverage or any of its incentives. For example, an employee might get Premium discount if he/she does not smoke, however, to my knowledge, there hasn’t been any case of Premium discount from seatbelt use.
Analysis #2, Top prevalent chronic health indicator
Analysis #3
3.1 Relationship of Healthcare Coverage & Health Status
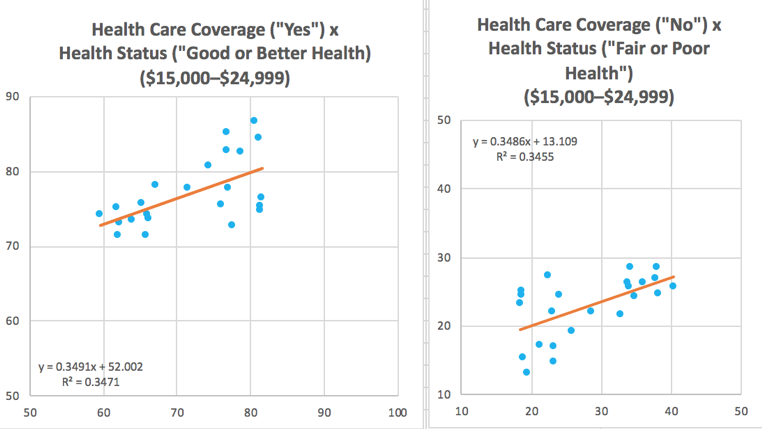
From the analysis shown above, the variation in the rate of health care coverage is responsible for ~35% of the variation in health status (R2 of ~0.35; this value seems to be meaningfully showing correlation in the social sciences[2]). Health care coverage and health status hints at moderate correlation.
- Relationship of LACK of Healthcare Coverage & Top Chronic Health Indicators
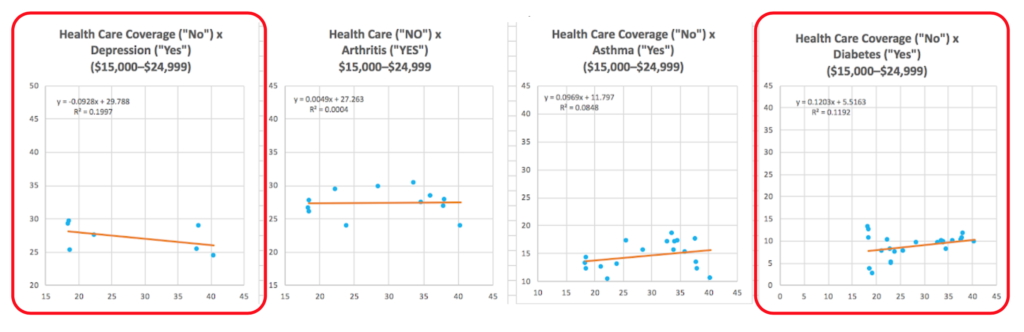
Health Care (“NO”) x Depression (“YES’) → R2 = ~0.19
Health Care (“NO”) x Arthritis (“YES’) → R2 = ~0.0004
Health Care (“NO”) x Asthma (“YES’) → R2 = ~0.08
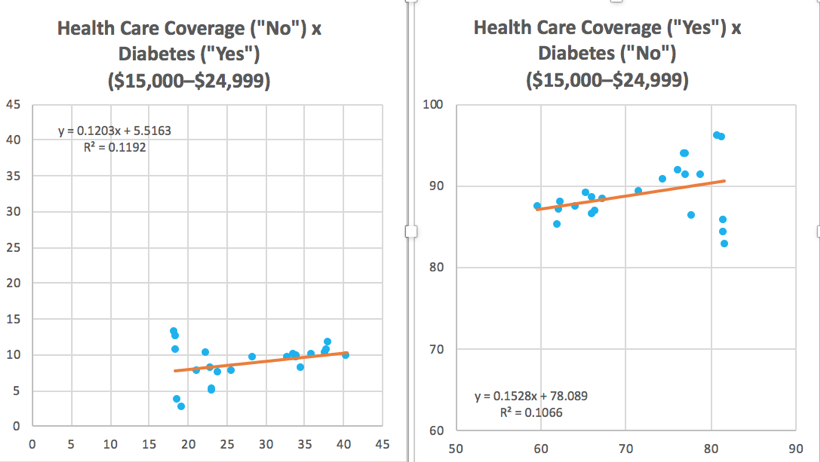
Health Care (“NO”) x Diabetes (“YES’) → R2 = ~0.11
Based on the R2 value alone, there seems to be little correlation between lack of health care coverage and top chronic health conditions.
Since Depression and Diabetes are the two with the highest value of R2,—and Depression being the top CHI—I’m going to limit my analysis further on just the two CHI.
1. Relationship of Healthcare Coverage & Depression
By using simple linear regression, the scatter plots shown on the left indicates that there are weak relationship (at least linearly) between whether a person has health care coverage or not with depression in WA [2011– 2017]
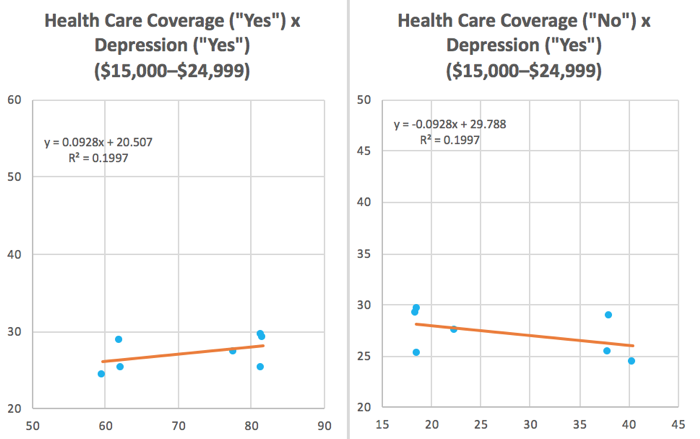
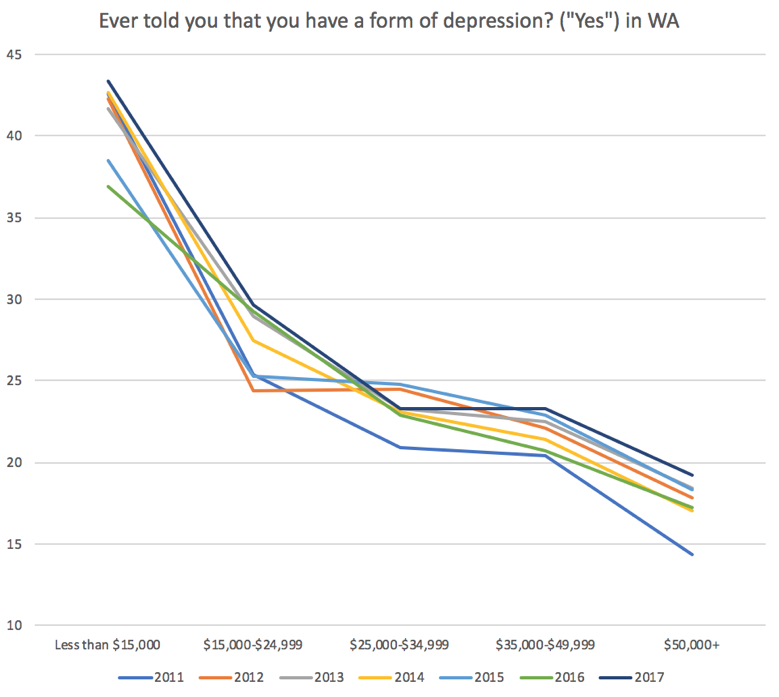
However, from the table in [Section VI, 5.], the chart on the left showed VERY strong correlation between the rate of people with depression [y-axis] with the income bracket [x-axis] in WA—the more income, the lower the rate of depression. Based on available data, the trend has been very consistent throughout the year [2011– 2017] with different year indicated by different color.
2. Relationship of Healthcare Coverage & Diabetes
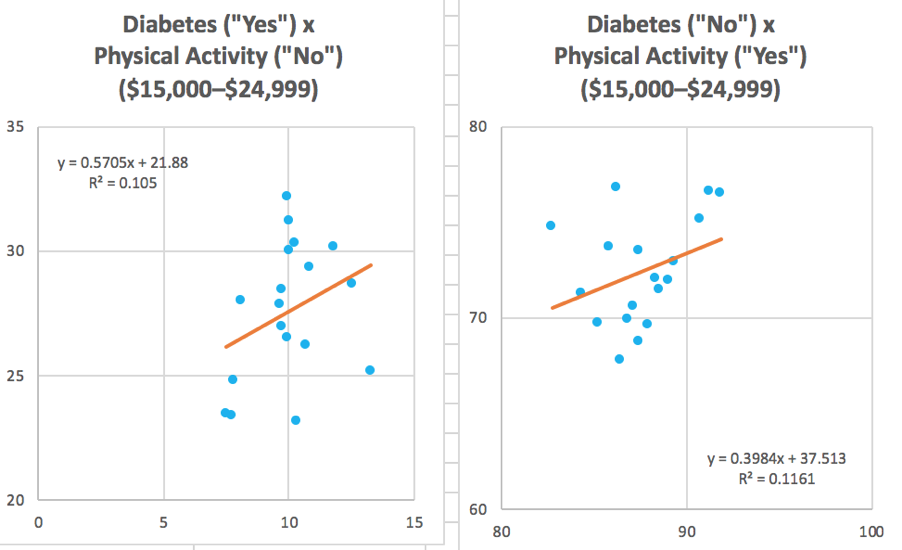
By using simple linear regression, the scatter plots shown on the left indicates that there are weak relationship (at least linearly) between whether a person has health care coverage or not with diabetes in WA [1995– 2017].
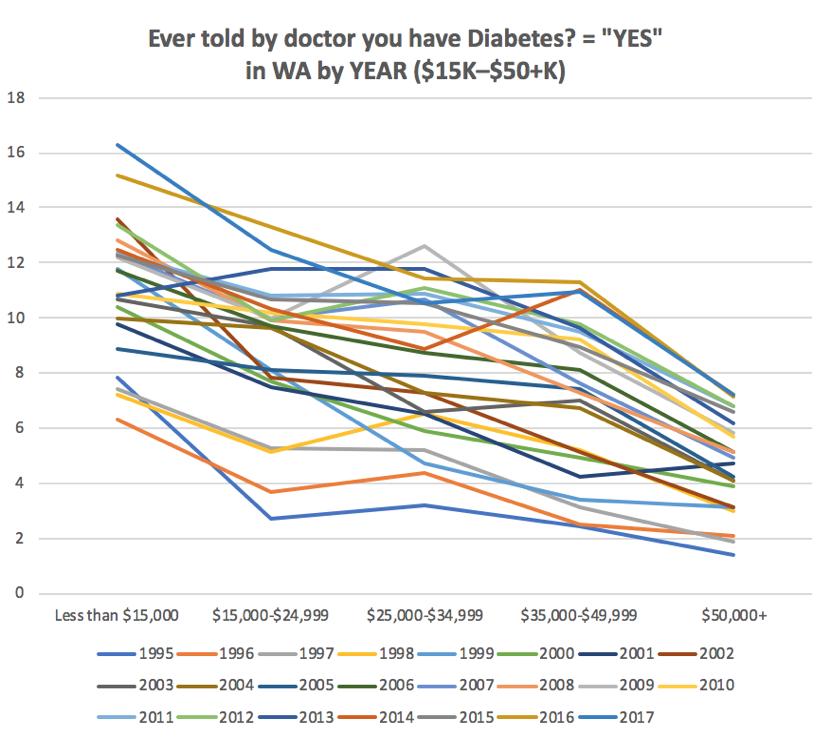
However, from the table in [Section VI, 6.], the chart on the left showed VERY strong correlation between the rate of people with diabetes [y-axis] with the income bracket [x-axis] in WA—the more income, the lower the rate of depression. Based on available data, the trend has been very consistent throughout the year [1995– 2017] with different year indicated by different color.
3. Upward trends in Diabetes and Depression
What seems to be worrying is that there seems to be upward trends year after year for people who have depression and people who have diabetes in all income groups. If we chart out the data, they look like:
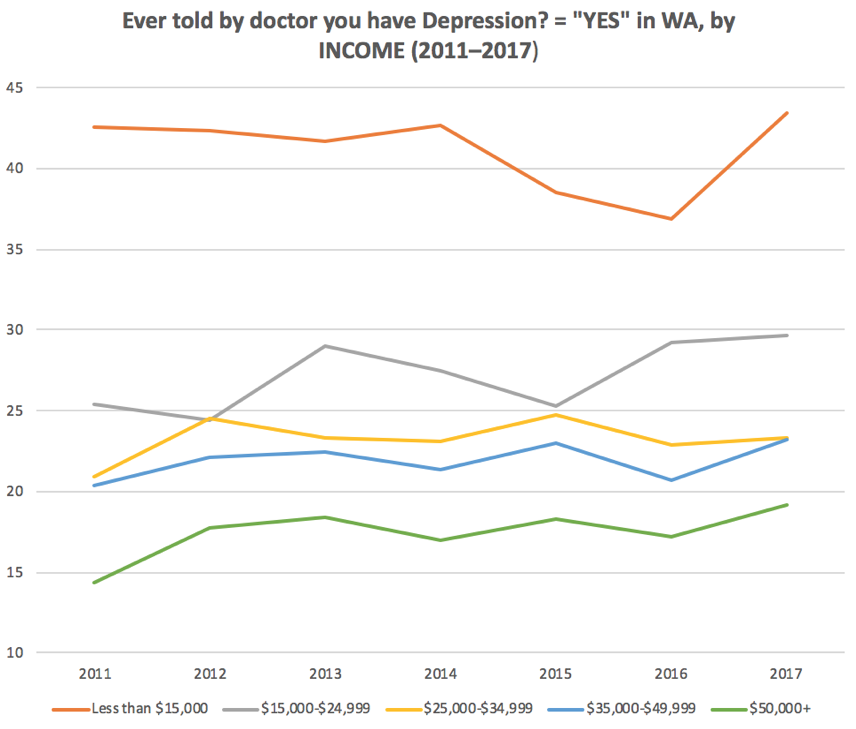
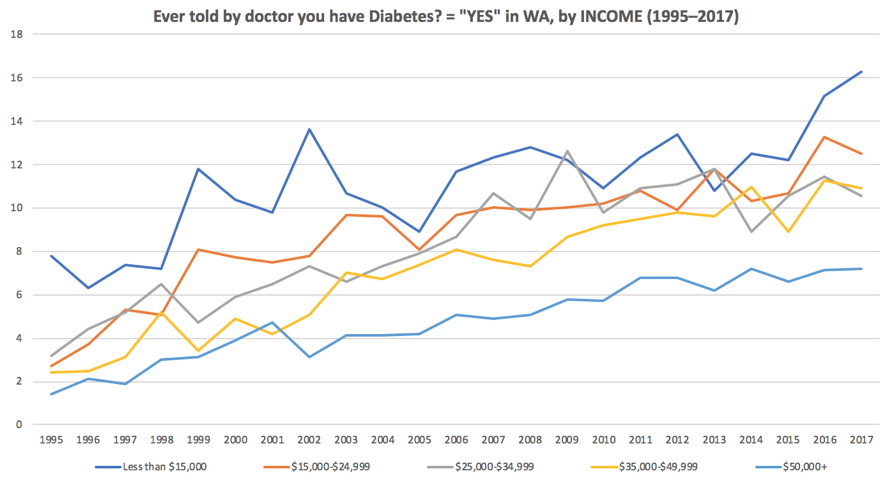
In both cases, the growth seems steady but sure, with much lesser pronounced growth in depression. For the income group differences, there are huge GAP between the lowest income group (<$15,000) and the subsequent groups. In the case of diabetes, in all income groups throughout the year, 1995–2017, the diabetes continue to rise for all income groups.
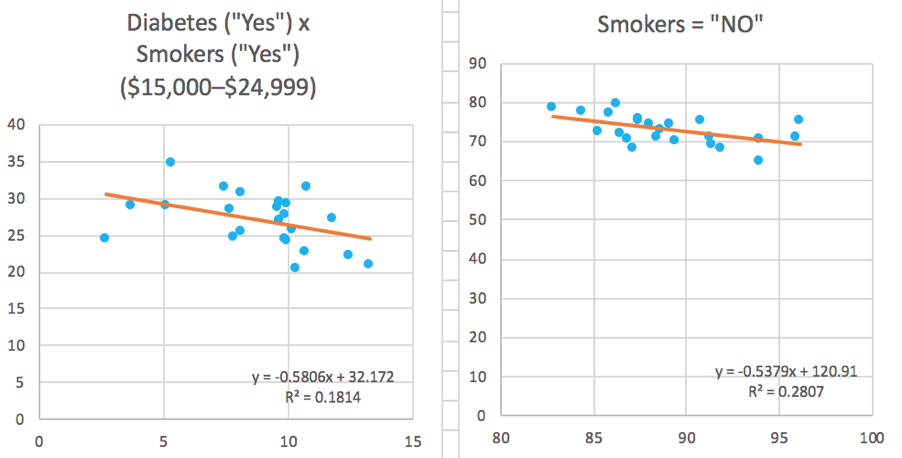
There seems to ALSO be little correlation between CHI like diabetes to specific preventive health care behavior as well. Below is the linear regression model between [Diabetes x Physical Activity] and [Diabetes x Smoking].
Non-linear relationship
Earlier we established that based on the R2 value alone, there seems to be little correlation between lack of health care coverage and top 4 chronic health conditions. However, this is based on linear relationship. Perhaps, there are still correlation in a non-linear relationship.
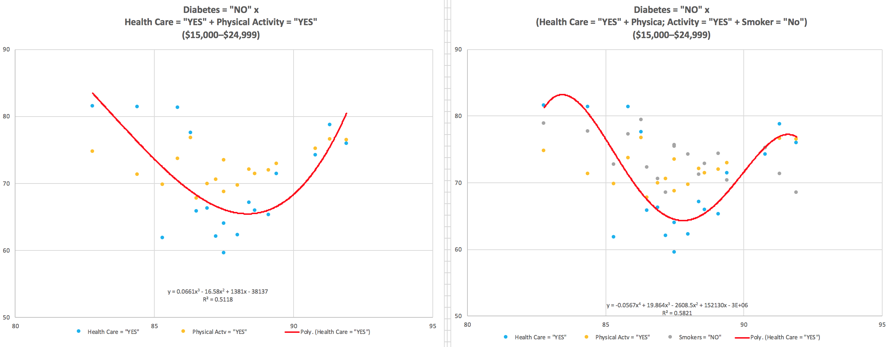
Above are non-linear relationship (polynomial regression) between multiple variables. I think that there are more correlation when the analysis model is more complex. However, it is out of scope (and expertise) at this point of the research.
REFLECTIONS + LIMITATIONS
1. To reflect caregiver demographic, target data category is very limited—only matching in “income level” ($15,000–$24,999). Thus, it cannot be treated like a definitive data. Other variables includes gender, age, etc.
2. Preventive Health Care behavior data pull is BIASED: it excluded activities related to women’s health, such as pap and mammogram. This is because the data pull is only focusing on “income-level” as the closest reflection of caregiver demographic, but by no means accurate.
3. Some analysis uses simple linear regression to find correlation between 2 variables. However, R2 is only one of measurements for indicating certain aspects of correlation. Thus, many different methods and models should be considered, including incorporating qualitative research (mixed-methodology).
SUMMARY
Generally, using simple linear regression, there seems to be some correlation hinted between “Healthcare Coverage” and “Health Status” in a linear relationship (R2 of ~0.35). However, two points of considerations:
(1) “Health Status” means several things and consists of multitudes of conditions, including both mental and physical well-being, and
(2) Health care is a complex system, and in complex system relationships are non-linear.
To investigate those two points, quick analysis of simple linear regression for the top CHI x Health Care Coverage was created and in general, there was no indication of linear relations when we look at the top 4 highest rate of CHI as individual components. There might be two related explanation:
(A) The top CHI does not have enough “individual” separate weight to account for linear relationship, which means more complex model might be better suited to measure healthcare relationships.
(B) In a complex system, conditions outside of the healthcare-related framework might play an influential factor as well, such as socioeconomic factor (income, education, etc.)—many of the analysis that is outside the scope of this project.
In the case of (A), it could be followed with future work, where the analysis uses non-linear model, because in the case of (B), I showed in the analysis above that in the example using Depression and Diabetes, they do not show any linear relationship between Health Care Coverage and each of the Chronic Health condition. However, further analysis showed that the Chronic Health conditions seems to correlate strongly with income level—one of the factors of socioeconomic conditions.
DESIGN PRINCIPLES
1. Given the importance of socioeconomic conditions, we should not ONLY rely on addressing the surface-level symptoms. Instead, we should look at the root causes of the problem, one of which seems to hint towards socioeconomic conditions—how do we elevate caregiving work so that the education of caregivers reflect the change of technological pace and development?
2. While addressing the root causes, it is also crucial to address the symptoms, even of it for short-term success. In doing so, we need to look at various factors that help caregivers improve their physical and mental well-being.
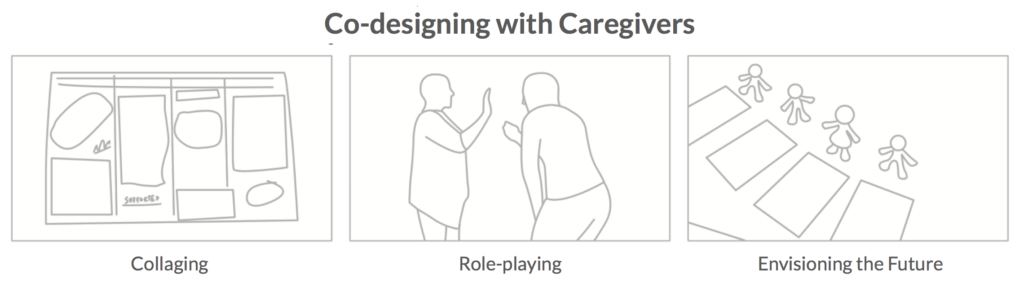
3. Approach problem from a human-centered framework. It is not enough to engage caregivers in doing research, we need to engage caregivers in design development as well. In co-designing, facilitators used generative workshops to get users to be active co-designers to address problems they encounters everyday. They are seen as the “experts” of their lived experiences. These generative workshops intend to harness the participant’s creativity derived from their experiences to solve problems that include, but not limited to, product development, systems and policy design.
REFERENCES
[1] https://phinational.org/resource/u-s-home-care-workers-key-facts-2018/
[2] Morgan, J. C., Dill, J., & Kalleberg, A. L. (2013). The quality of healthcare jobs: Can intrinsic rewards compensate for low extrinsic rewards? Work, Employment and Society, 27(5), 802-822. doi:10.1177/0950017012474707
[3] Schulz, R., & Eden, J. (2016). Families caring for an aging America. Washington, DC: The National Academies Press.
[4] http://condor.depaul.edu/sjost/it223/documents/correlation.htm