TEAM
Darwin
RESPONSIBILITY
• Develop Theoretical Framework
• Concept Design
• Concept Data Model
• Prototyping [Python, Networkx]
OBJECTIVE
This is a preliminary concept exploration to understand a high-level user behaviors as emergent property in a complex network system.
BACKGROUND
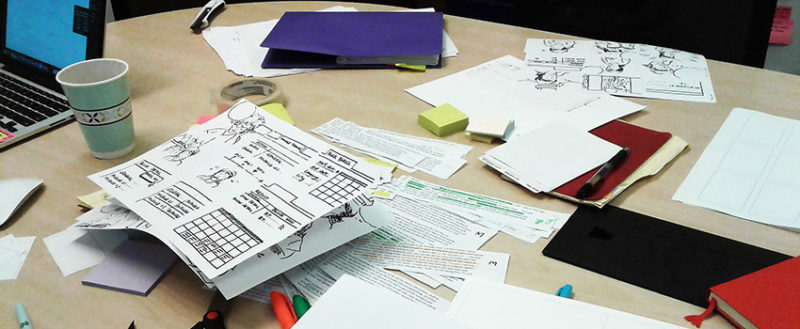
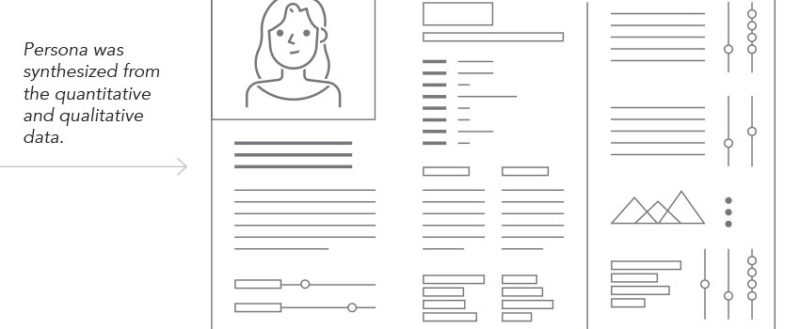
Few of the most common tools used for qualitative analysis includes storyboards, journey maps, and so on, much hinging on narrative form in one way or another. In mixed method analysis, insights are generated, usually to complement each other, regardless whether it’s sequential exploratory/ explanatory design, or concurrent triangulation, etc. However, the concept I’d like to explore here is to ask whether qualitative data can be built into quantitative ones, which in turn can show high-level collective behaviors of users.
THEORETICAL FRAMEWORK
Emergence is a phenomena that is usually present in a complex system. Before we go further, first, a system is defined as “an interconnected set of elements that is coherently organized in a way that achieves something” (Meadows, 2009, pg.11), which means a system should at least consist of: Elements (or Components): the basic building blocks, Interconnections: the “relationships that hold the elements together”, and Function or Purpose.
Unlike simple systems, complex systems are exceedingly difficult to see (and make sense of) from a single point of view. Sometimes the components self-organize and create new behaviors or functions. Such systems have the properties of emergence. John Stuart Mill pointed out that, contrary to the “composition of causes” that the joint of the parts is “identical with the sum”, in emergent systems “the juxtaposition of those parts in a certain manner, bear no analogy to any of the effects which would be produced by the action of the component substances considered as mere physical agents” (1889, p. 243). In other words, the whole “is more than the sums of its parts [italics mine]” (Meadows, 2009, pg.12). As such, an emergent phenomenon will be defined as: a distinct and new high-level (complex or abstract) property, such as behavior or function, emerges from the self-organizing aggregation and interaction of the lower-level (simple or rudimentary) components.
MODELING
The challenge here is then to make qualitative data quantifiable. The model I will start with is using graph theory: G = (V, E), where G is a graph, and V is a set of vertices, and E is a set of edges. Think of vertices V as nodes or components and the edges E as the interactions of those components. If V has 3 components: V = {1,2,3} and they all interact with each other, then it will naturally follow that E has 3 edges as well: E = {{1,2}, {2,3}, {3,1}}. What is expressed is called an undirected graph (without arrows using curly brackets), where for every pair of vertices u and v in V, there is an edge e of E between them (u,v): ∀ u,v ∈ V ⟹ (u,v) ∈ E. In a directed graph, the order of the components matter: E = {(1,2), (2,3), (3,1)}, which means the node 1 go to node 2, and node 2 to 3, and so on (because the graph forms a close loop, i.e., beginning and end with the same node, this graph is considered a “cycle”.
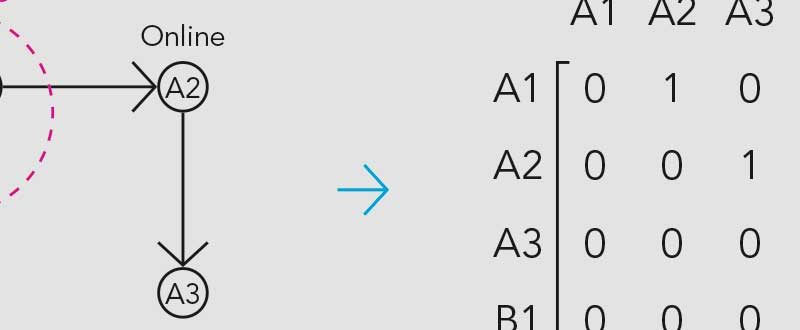
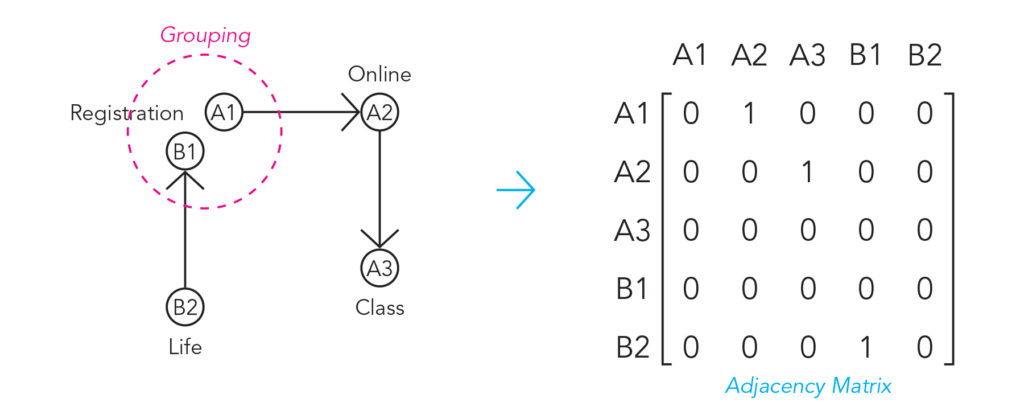
But in our case here, we will simplify the thought process into a diagram and forgo the logic/math notations. First is to “convert” a qualitative data, such as a sentence, to a directed graph — let’s call this a Qualitative-Graph Conversion (Q-GC). The directed graph can be expressed using adjacency matrix (as in linear algebra).
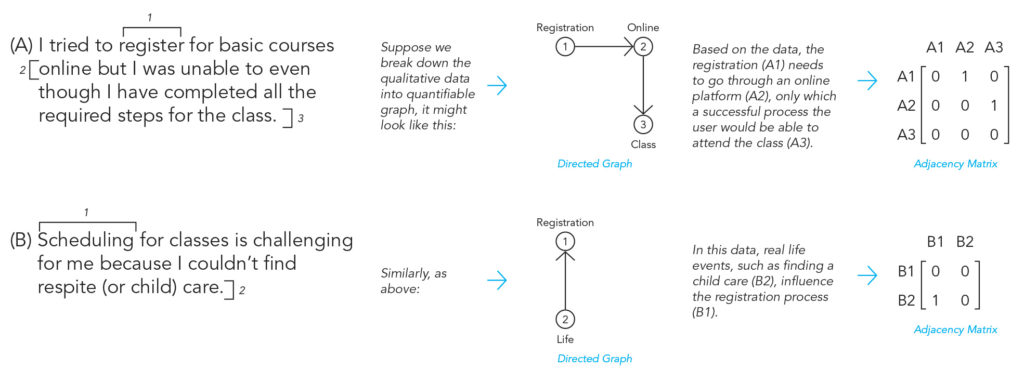
Below are examples where qualitative data (A) and (B) going through Q-GC.
Statement (A) consists of three nodes (A1) (A2) (A3) with Q-GC of (A1)→(A2)→(A3).
Statement (B) consists of two nodes (B1) (B2) with Q-GC of (B2)→(B1).
In retrospect, it is perhaps more appropriate in the example above to consider ACTORS (such as the subject (student, teacher, etc.) and the objects (online classes, etc.)) as the nodes rather than the action.
This is the basic model that would lay the foundation of creating the network visualization. Consequently, the more the qualitative data are converted to graph, i.e., Q-GC, the closer it would be in becoming a network.
Let’s suppose that we have more qualitative data (C), (D), (E), and (F).
Statement (C) consists of four nodes (C1) (C2) (C3) (C4) with Q-GC of (C1) → (C2) → (C3) → (C4) .
Statement (D) consists of three nodes (D1) (D2) (D3) with Q-GC of (D1) → (D2) → (D3).
Statement (E) consists of two nodes (E1) (E2) with Q-GC of (E1) → (E2).
Statement (F) consists of three nodes (F1) (F2) (F3) with Q-GC of (F1) → (F2) → (F3) .
Below is a simple graph built with Python, where nodes are randomly placed. For now, we do not need to use the adjacency matrix, since in Python nodes like (A1) → (A2) → (A3) can simply be expressed with Networkx as:
G.add_edges_from([('A1', 'A2'), ('A2', 'A3')])The result looks something like this:
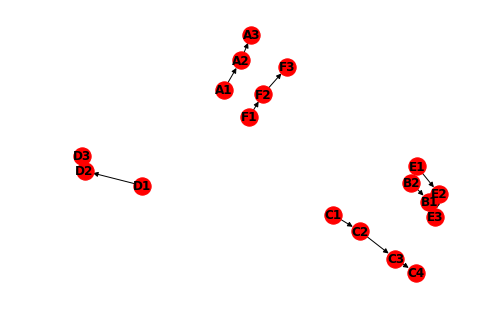
However, the nodes are randomly placed in the space without discernible pattern. In order for the graphs to be plotted more meaningfully, one of the rules is to organize the nodes based on specific themes that emerged from the Q-GC. Based on the example above, both A1 and B1 are relevant to the theme related to “registration”, so they should be grouped together.
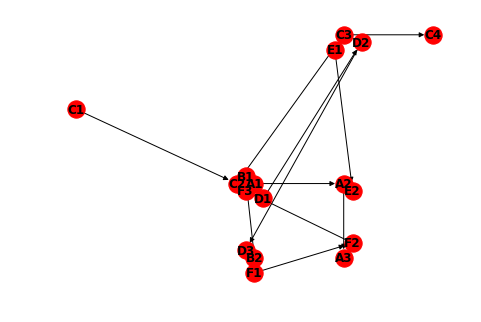
Taking the exact same data from above (statement A, B, C, D, E, and F), when we group based on themes instead of statements, some kind of resemblance of network would emerge. Again, in a simple Python prototype, after the Q-GC and the groupings, the graph would look something like this:
SUMMARY
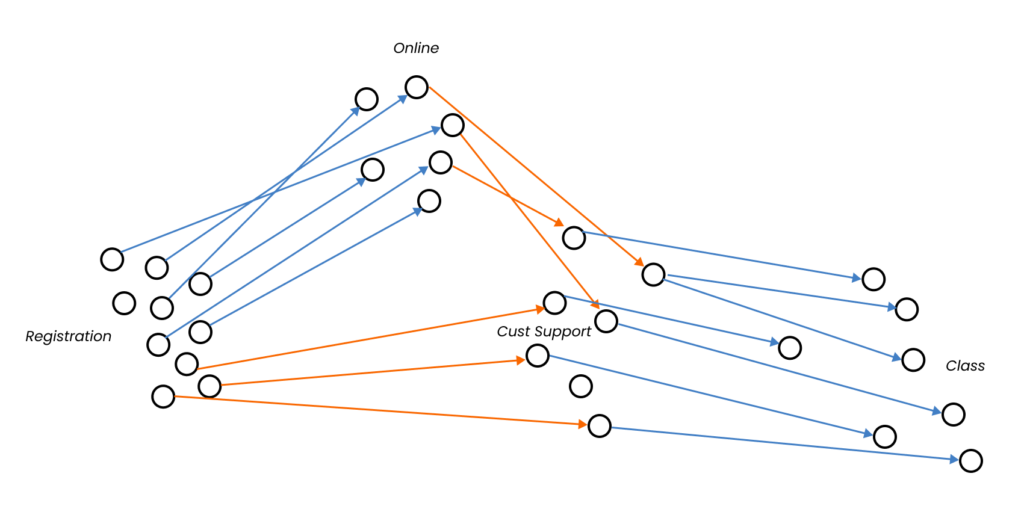
Potentially, the collected and collated qualitative data can be expressed into a kind of interactive network map, where the nodes would “light up” and “sends signals” (through the edge) to other nodes in an event (for example, during Registration). This is why the directed graph method is useful here—we can see HOW the nodes interact within the network and potentially see the complex behaviors emerge.
For example, we might noticed that when [Registration] cluster lights up it leads to other clusters, say [Online] and [Customer Support], but [Customer] cluster leads immediately to [Class], but [Online] cluster leads back to [Customer Support] first before eventually to [Class]. So it says something about that kind of “behavior”.
In addition, each edge can be color-coded to be assigned a specific value, say “red” for negative experience and “blue” for positive one. So as the interactivity happens, we can detect the overall network sentiments. Diagram below illustrates it would be in a network visualization instead of diagram.
[Online] (-)→ [Customer Support] (+)→ [Class]
↗
(+)
[Registration]
(-)
↘
[Customer Support] (+)→ [Class]
And what a network would look like:
There are, then, 3 aspects of the system:
1. [Object] → the data to be clustered
2. [Direction] → from [Object 1] to [Object 2]
3. [Quality] → positive or negative
REFLECTION
1. How to categorize statements in qualitative data through the lens of natural language processing, sentiment analysis and cluster analysis?
2. Would this technique or a machine learning technique more resource intensive? Could use an algorithm to classify sentiments?
3. In retrospect, it is perhaps more appropriate in the example above to consider ACTORS (such as the subject (student, teacher, etc.) and the objects (online classes, etc.)) as the nodes rather than the action.