TEAM
Darwin
RESPONSIBILITY
• Define problem + research questions
• Find and collect raw data
• Query [SQL] + clean data [Excel; Pivot Table]
• Analysis + Data Visualization [Tableau]
OBJECTIVE
The purpose of this research project is to understand tech adoption and use of our organization’s client—caregivers who work in Washington State. While I only use general US population data in 2015, I look at and analyze the demographic data that reflects that of our caregivers. Simple theories are postulated: that Washington state would have one of the highest tech adoption rate because of tech hub cities such as Seattle, Bellevue, and Redmond, that younger age group and higher income group would have higher tech adoption rate than their older and lower income counterpart. After the analysis, I found that part of those hypothesis is true, part is false (such as WA as high tech adoption state), and all of them are part of larger systemic issues.
BACKGROUND
In the US, about 10,000 people turn 65 every day—a reality that means the elderly population will disproportionately outnumber the general population in the near future. To meet the demand to provide quality care for our aging population, our organization manages the training requirements, health benefits, and secure retirement for prospective and current active in-home caregivers in Washington State.
WHO WE SERVE IN WASHINGTON
8 out of 10 are women*
58% are age 50 or older*
66% work part time as an HCA*
18% have a college degree*
Average base pay is $23,831/yr**
*http://depts.washington.edu/uwrhrc/uploads/Home_Care_Aides_Brief.pdf
**https://www.glassdoor.com/Salaries/washington-state-caregiver-salary-SRCH_IL.0,16_IS3020_KO17,26.htm
PROBLEM STATEMENT
Since our organization manages much of the training and certification of caregivers, our training delivery (e.g., registration, courses, etc.) is transitioning more towards tech and online space. We try to keep innovating our service delivery for our caregivers so that they not only would have the best experiences, e.g., completing their training as quickly as possible and on time, etc., but also to be able to serve their clients better. In order to be able to rollout the most appropriate service interventions, we need to understand our caregiver population in Washington state in relations to technology, namely:
“What is the tech usage & adoption rate between our caregiver pop in comparison to WA state pop?”
HYPOTHESIS
1. Because Seattle is one of the tech hubs, WA might have one of the higher tech adoption and usage rate compared to the rest of the US.
2. The older age group usage and adoption of technology is probably lower than other younger age groups, which missed the benefits of tech adoption in the industry, especially if it benefits their health and/or user experience.
3. The same with income groups, higher income groups might have better tech usage and adoption rate than lower income group, because higher income will have more resources to tech (and perhaps they live in areas with faster tech adoption in the industry, e.g., WiFi connections).
DATA COLLECTION + DISCOVERY
Broadband adoption from data.gov (https://catalog.data.gov/dataset/broadband-adoption-and-computer-use-by-year-state-demographic-characteristics)
- The dates goes from 1994 to 2015, thus we could probably see certain trends
- There are different age groups as well for comparison analysis. It will be interesting to see how the trend moves from the 90’s to 2015 with the same age group.
- The “variables” are very useful to get a sense of what tools certain age groups use (such as video user, text user, etc) as it relates to the design of our service deliveries.
- Income group is also relevant to our caregiving population as most caregivers falls into lower-income bracket and might face certain challenges in accessing technology
DATA GAP
The data source is for general US-wide population. It’s not specific to the population of our caregivers. However, we are inferring some attributes from the US population, i.e., income group, with the attributes of our caregivers, e.g., income, etc.
DATA MODEL + VISUALIZATION
When modeling data, the variables need to be more specific than general in order to get a better picture of tech adoption because not all variables are valued the same. For example, in the variables there are descriptions of different users such as “audioUser”, “callconfUser”, etc. which are behaviors of tech adoption and usage, but there are some variables that are measurement of sentiments, such as “noComputerMainReason”, and some are measurement of no tech adoption, such as “noInternetatHome”.
Results #1: Tech Adoption is a Complex Problem
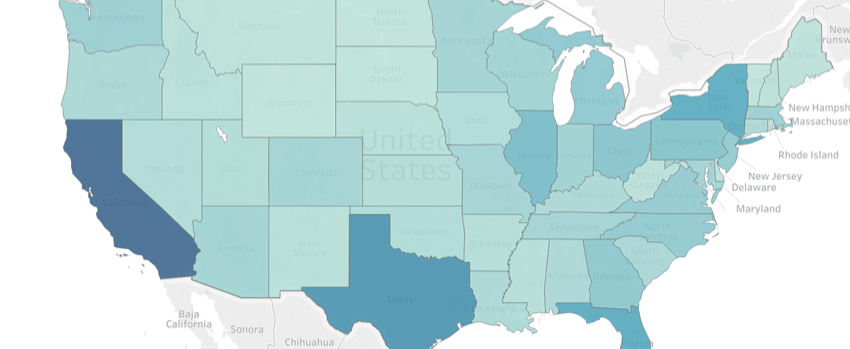
When we consider the rank, WA is also not ranked on the top and CA, which is supposed to be the most dense tech hub (i.e., Silicon Valley) actually ranks way below on 35. What could be the case? First of all, the numbers don’t show or explain everything. Secondly, it seems that while the hypothesis of “tech hubs = high tech adoption rate” is a deceptively simple one, it is actually a complex question. One could conclude that we cannot rely purely on simple variables to a complex question. The issue of tech adoption might relate to inequalities of wealth distribution, thus, preventing access to technology.
The population data was obtained from:
https://factfinder.census.gov/faces/tableservices/jsf/pages/productview.xhtml?src=bkmk
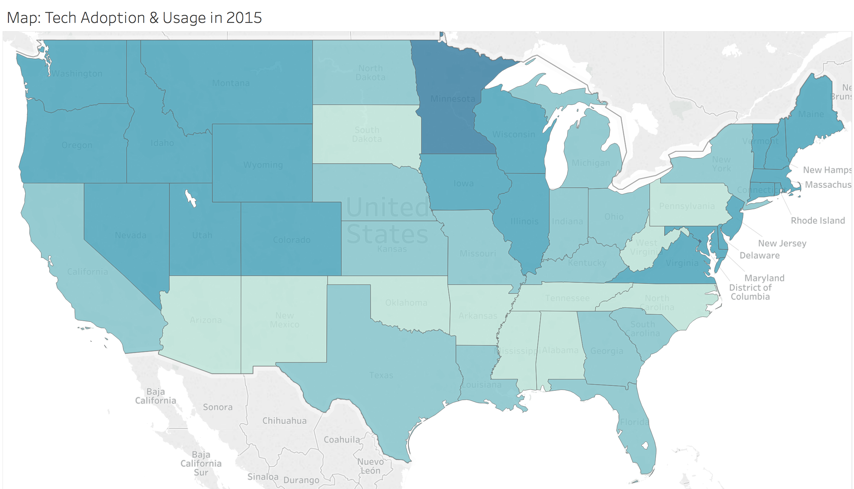
| Rank | State | Prcnt_2015 | Rank | State | Prcnt_2015 | |
| 1 | DC | 16.66 | 9 | WA | 13.82 | |
| 2 | MN | 14.43 | 10 | AK | 13.80 | |
| 3 | WI | 14.20 | 11 | NH | 13.79 | |
| 4 | VT | 14.02 | 12 | CO | 13.77 | |
| 5 | OR | 14.01 | 13 | NV | 13.76 | |
| 6 | ME | 13.95 | 14 | MA | 13.73 | |
| 7 | IL | 13.91 | … | … | … | |
| 8 | DC | 16.66 | 35 | CA | 12.41 |
DESIGN PRINCIPLE, PART I
I think that often times, we shouldn’t take readily available tech for granted. While our organization is pushing innovations, we need to look beyond technology and integrate other intangible service innovations as well. More importantly, we need to understand the population we serve even better in terms of their accessibility to different resources. Just because the resources are there, not everybody has access to them. The constraints that we have, especially with the population we serve, e.g., lower-income and older age groups:Technology, at the present time, still remains a consumer privilege rather than public/social benefits.
Results #2: Mobile Prominence in Lower-Income Group
Mobile phone is becoming one of the most prominent device used by different age and income groups. The age groups is similar our caregiver population (45–64), is actually keeping up with the younger age group (25–44) is adopting mobile technology. Furthermore, income group that reflects our caregiver population (Under $25) and ($25–49K), also use mobile phone most prominently in comparison with the other devices.
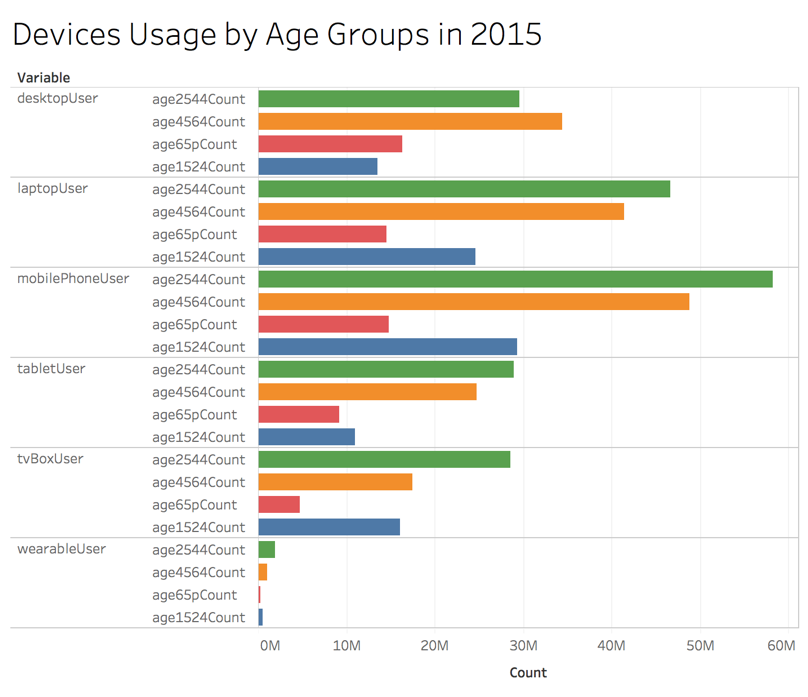
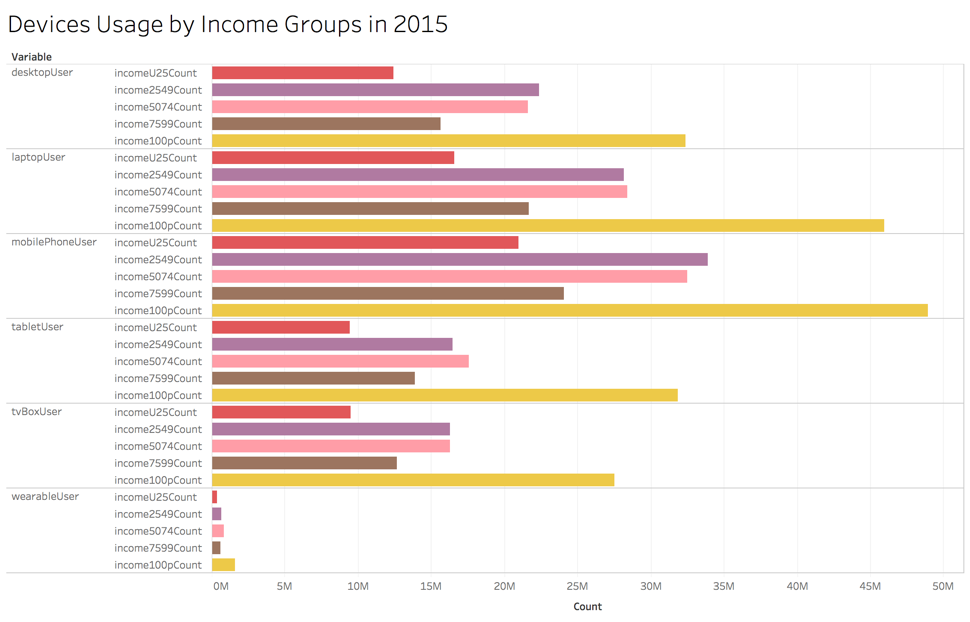
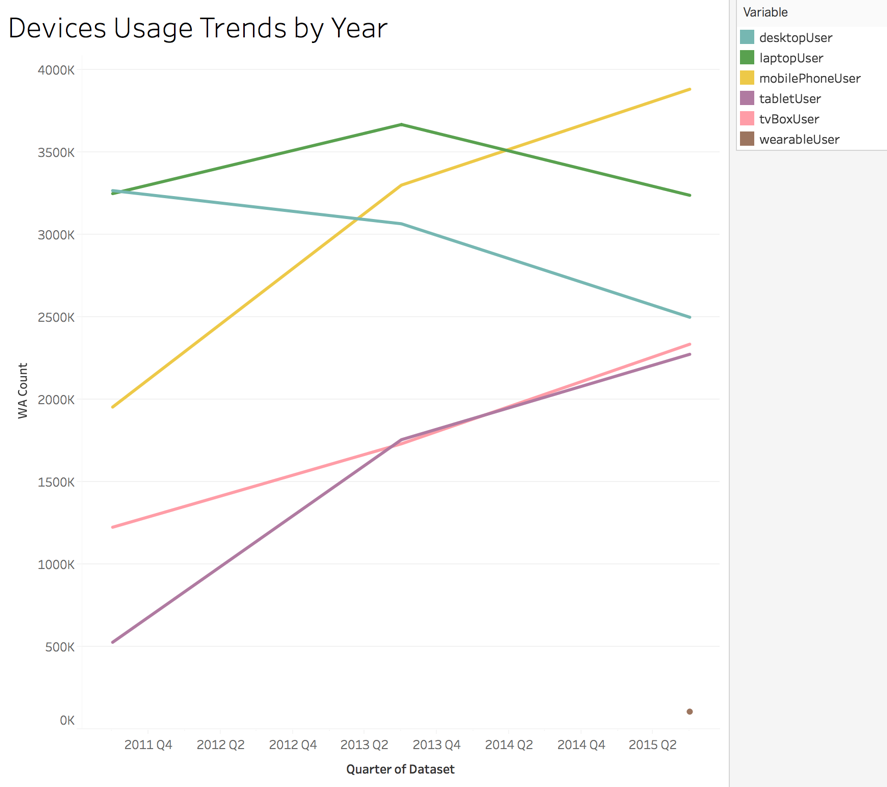
When we look at the overall trends, favoring to use mobile device keeps increasing steadily (data up to 2015) especially when in comparison to laptop and desktop computer.
This is consistent with the Pew Research Center report on Digital Divide Persists Even as Lower Income Americans Make Gains in Tech Adoption, which states that “many lower-income Americans are relying more on smartphones” because lower-income Americans have limited accessibility to resources including having no access to “broadband internet at home”. This lack of internet access is, again, consistent with our analysis where the people in the lowest (Under $25) and lower income group ($25–49K) (a reflection of our caregiver population) overwhelmingly lacks internet access at their homes, in comparison to other income groups.

The Pew Research Center also remarked that the reliance of smartphones by people in lower-income group, means that they “are more likely to use them for tasks traditionally reserved for larger screens.”
Another consideration is also on the “Internet Location Usage” where “on-the-go” internet connections are widely popularly used by all income groups including the the lowest (Under $25) and lower income group ($25–49K). In the commercial industry, different network carriers have different kinds of data plan. For people in the income group reflective of our caregivers, their choices might also be limited to the affordability of their own constraints.


DESIGN PRINCIPLES, PART II
The caregiver population our organization serves are faced with resource limitation related to access to the internet and it might be deeply influenced by the wage they receive as caregivers. There are three principles to consider when providing tech-related service to our caregivers in order for them to have the best experience possible:
1. Mobile-First Approach in Design
When designing digital experience for our caregivers, consider “mobile-first” approach in design, which means start the design process to cater to mobile devices, because of the mobile device adoption and usage trends amongst the population that are similar to our caregiver’s demographic. Then, the design would be responsively adaptive on the other devices.
2. Data Bandwidth Considerations in Training Material Delivery
In developing our educational materials for our caregivers, we need to figure out how to disseminate those materials to our caregivers efficiently. Thus, we have been adopting more towards digital content using massive open online course (MOOC) as a model for delivery. However, we need to consider not only the limitation of access to the internet, but also the limitation of data bandwidth that caregivers may have each month.
3. Mobile Device Capacity for Health-Related Apps
One of the services we offer to our caregiver is health-related programs, mostly by using apps, to ensure the well-being of our caregivers. We do not have any data on what kinds of specification the devices our caregivers have nor do we have any data to infer from. However, offering multiple services through apps might take a toll on caregiver’s devices.
REFLECTIONS
1. Realized that underneath deceptively simple questions hide a complex systemic issues.
2. One (1) data source is very limited in what it can tell us. Even from a complete and detail data set, lack of context really limits the scope of what analysts can try to understand.
3. I would first start the project from the very beginning of the class and reframe multiple questions under the same theme. I would probably spend more time studying and analyzing the data and considering using mixed method with qualitative data as well.

