TEAM
Darwin, Design Researcher/Service Designer
Michelle S, Manager of Human-Centered Design & Research
Winnie W, Adult Education Program Manager
RESPONSIBILITIES
• Strategic Design Process
• Project Proposal + Lead
• Design Research Methods
• Conduct Interviews + Facilitate Workshops
• Organize Data
• Facilitate Analysis Sessions
• Synthesis
• Storyboard
• Develop Journey & System Map
OBJECTIVE
Create a collaborative tool that complements user journey map.
BACKGROUND + DEFINITION
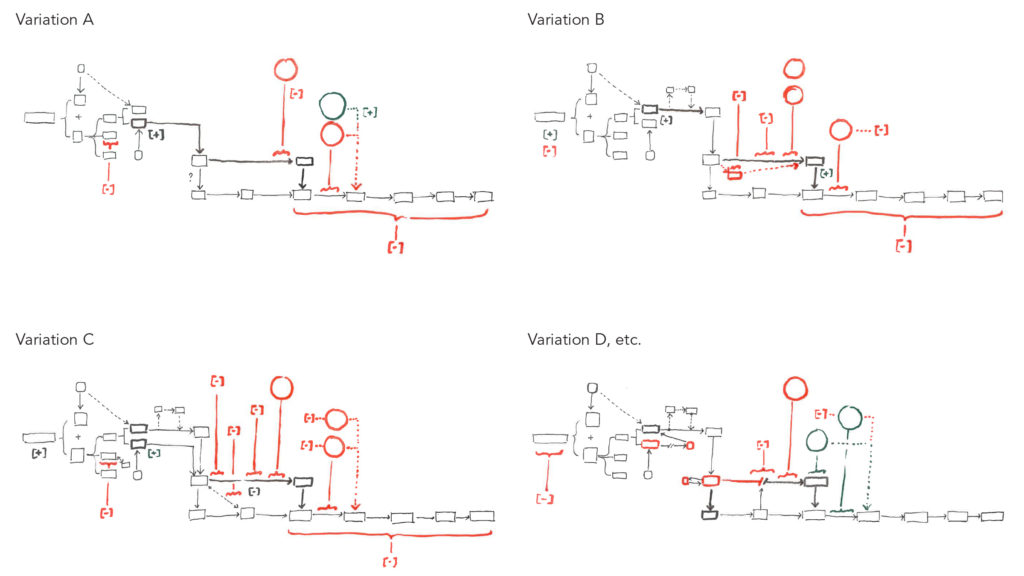
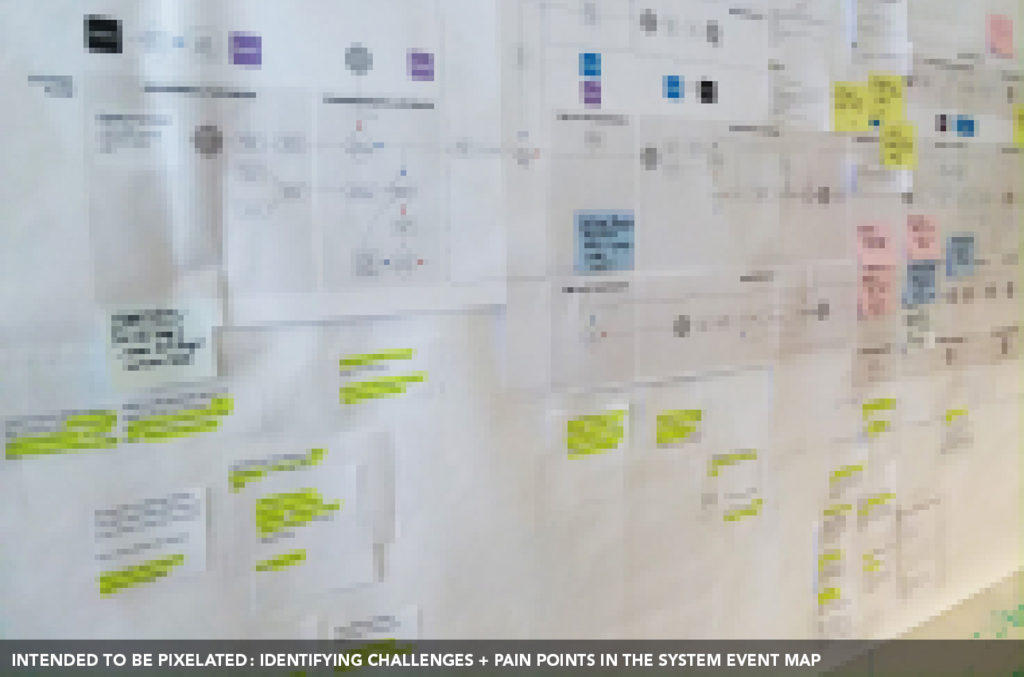
When facing a system of overwhelming complexity, few single individual have the absolute knowledge or understanding how the system works. The problem would further deepen the complexity when various departments in an organization trying to solve the same problem without communicating with one another. Inspired by “Service Blueprint”, the System Event Map (SEM) outlined the detailed steps and processes the users have to go through from the beginning of a phase until the end — unlike Service Blueprint, SEM’s steps and processes are much more detailed. SEM started from simple diagrams that outlined discrepancies of various users going through the same processes, including the pain points and challenges they encountered. Later, SEM evolved to exclude user’s experiences, and focusing solely on the required steps users need to go through from beginning to the end of the process. Below are examples of early variations of SEM of different users.
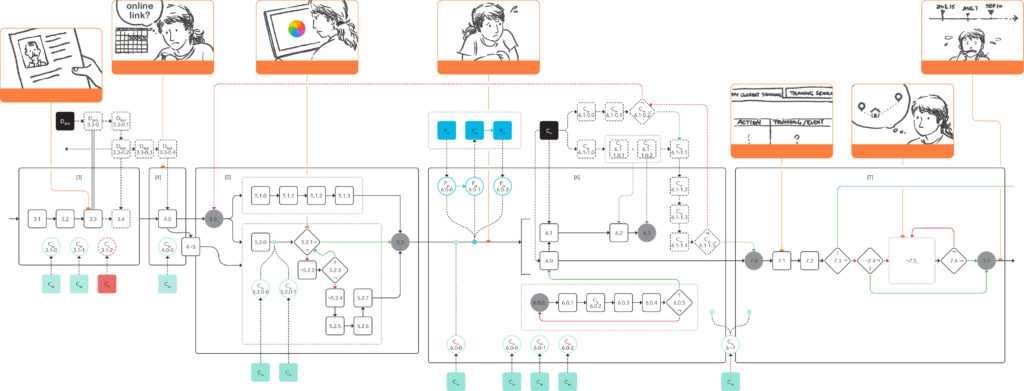
ANATOMY OF A SYSTEM EVENT MAP
Below is an example of what a SEM would look like. The SEM consists mainly of the front-end and back-end process. The front-end is the process the users have to go through. The back-end is the process, either internal or external of the organization, functions to serve the front-end process. Most of the phases have: a defined beginning (⬤) and an end (⬤), processes (▢), and decisions (◇) — there are other variations, but these are the basic elements.
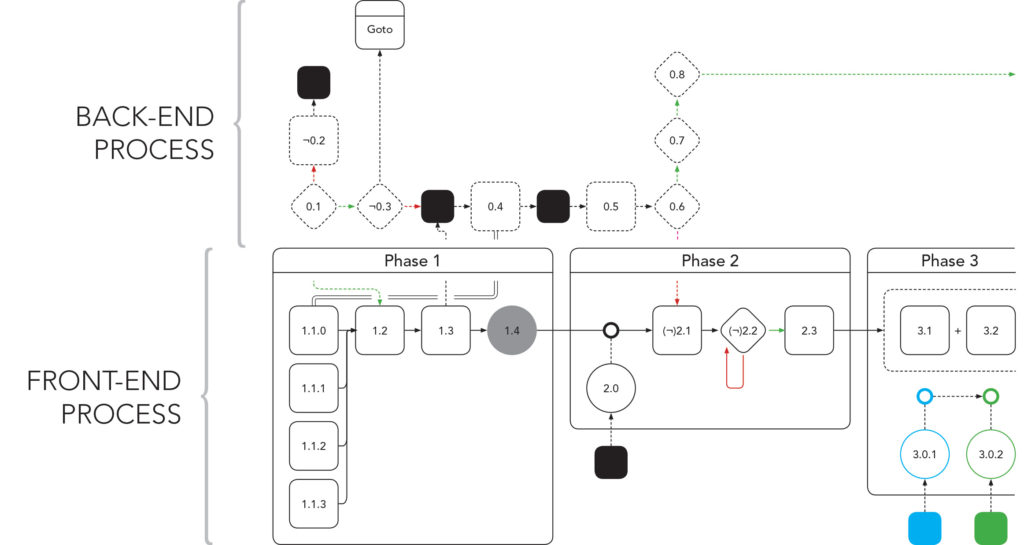
One of the early advantage came out of using SEM was when different teams look at a specific SEM and discovered areas of collaborations where they could potentially design interventions together, or realized that there had been duplication of efforts that tried to accomplish the same goal but without the consistency that benefits the users.
RESEARCH METHOD
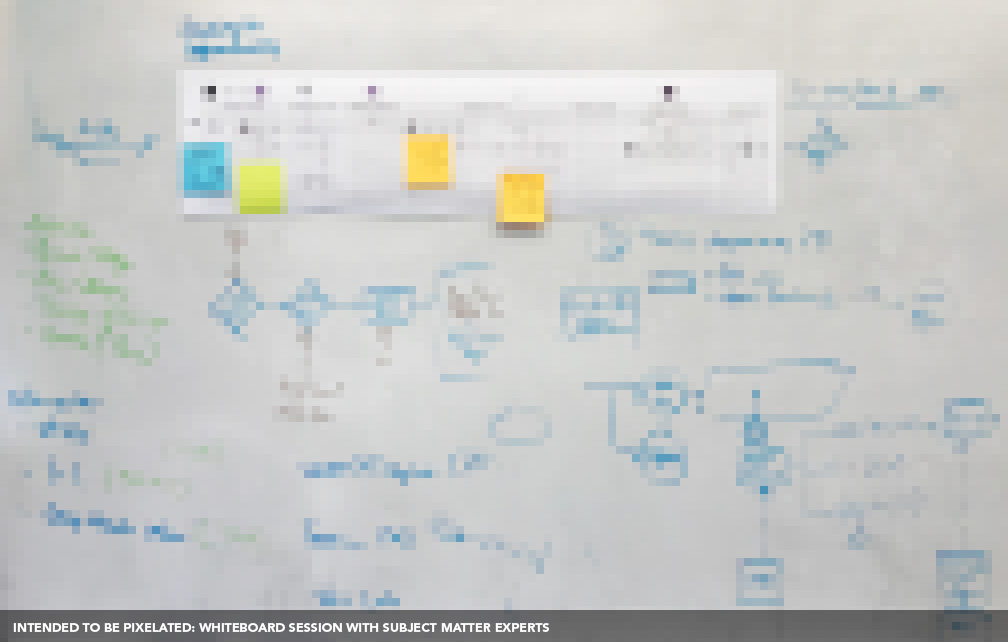
1. Workshops (Internal + External) → SEM
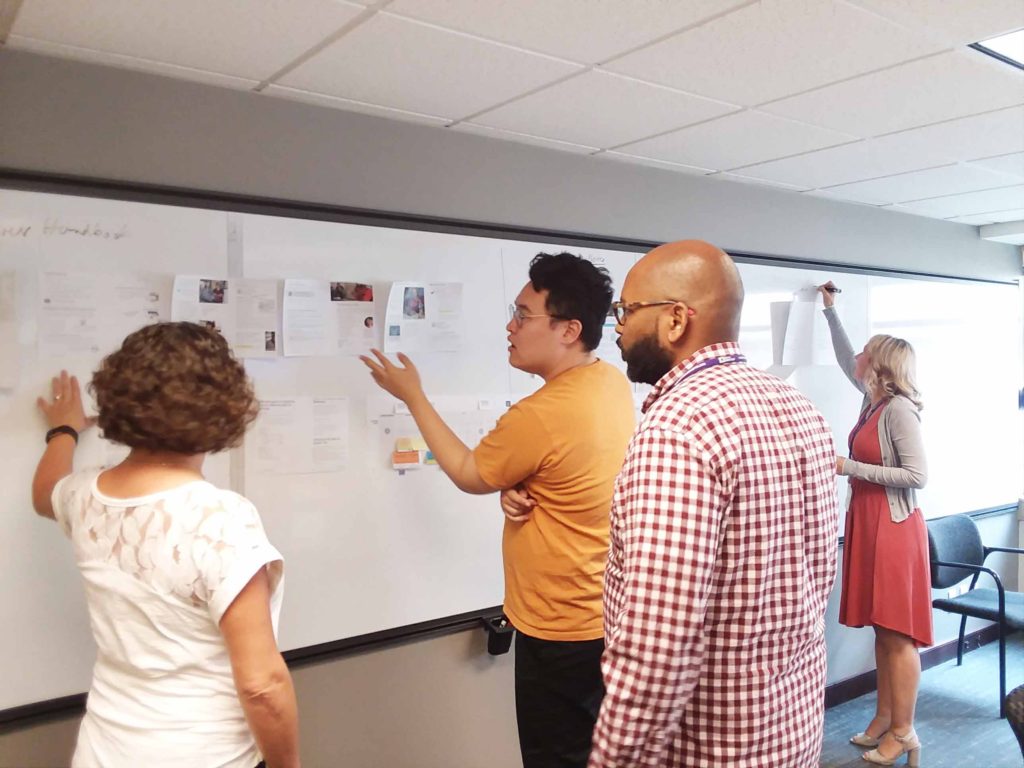
The workshops were informal process where the facilitator begin with a series of questions to the participants (usually are subject matter experts (SMEs) in various areas) about user journey. However, instead of uncovering user experiences, the facilitator would need to ensure that the steps users take are based on the required tasks, instead of real live experiences. The workshops are usually conducted using a whiteboard. As SMEs explained and responded to the research inquiry, the facilitator would start sketching out roughly in a diagram form.
2. Interviews (External) → SEM + Journey Map
While technical-oriented audience would understand the mechanisms behind the SEM, relating to user’s experiences (thinking + feeling) and pain points in the journey map help generate empathy to the users when thinking about design interventions. Thus, it’s important to conduct qualitative research to build journey map accompanying the SEM.
CASE STUDY: CAREGIVER ON-BOARDING EXPERIENCE
Caregiver in Washington face unique challenges in the on-boarding experiences. While the barrier to entry into the field of caregiving is not very high, there was a lot of information that prospective caregivers need to digest and a lot of paperwork to be completed. Thus, there are many intervening points from various agents, such as DSHS (Department of Social and Human Services), contracting agents, and various departments in the organization. As such, in order to create a more cohesive and comprehensive on-boarding experience for the prospective caregivers, the teams in our organization need to align in goals and understanding of not only the caregivers’ experiences, but also the processes that are required of them.
QUALITATIVE RESEARCH: 1-ON-1 INTERVIEWS
The main research inquiry for caregiver on-boarding experience was through 1-on-1 interviews. While the interview was limited in sample size (sampling based on specific personas developed of various caregiver segmentation), it was in-depth and as thorough as it can be to understand the totality of caregiver’s experiences given the limitation. As a result, rich qualitative data was generated from ~10 interviews.
ANALYSIS + SYNTHESIS
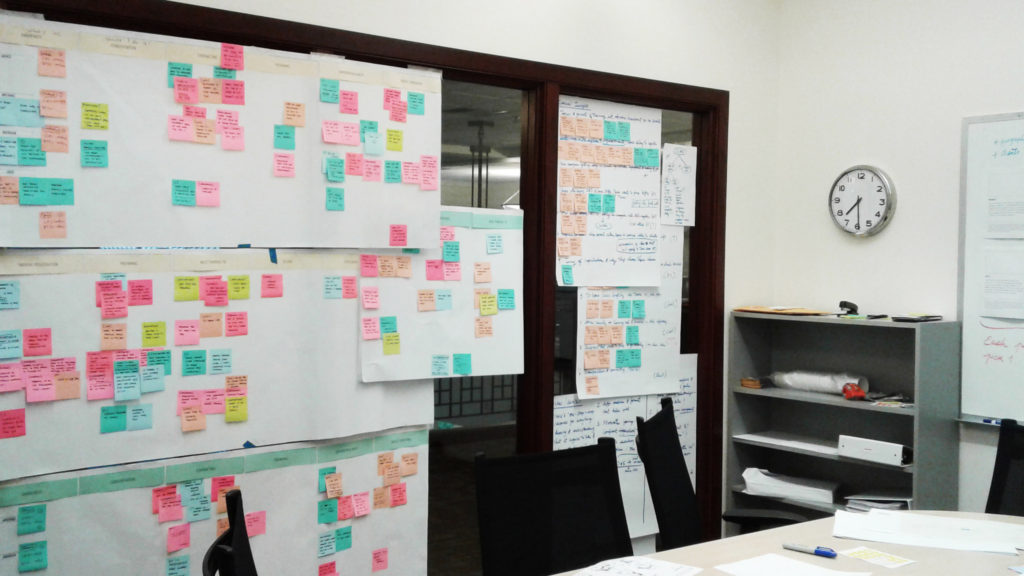
1. Generate themes based on pre-established framework and phases (of events).
2. Clustering the themes as means of organizing the qualitative data.
3. Call out Barriers, Challenges, Pain Points, etc., in each phase.
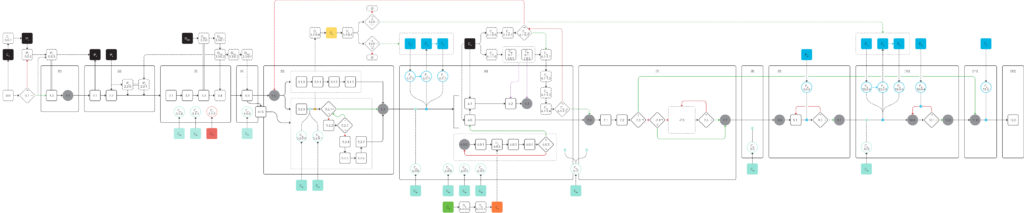
BUILDING SEM
After the initial analysis and synthesis, the SEM for caregiver on-boarding experience would be built by conducting multiple small workshops with the organization and outside agents (such as DSHS). When the rough SEM was sketched out, the analysis (barriers, challenges, motivations, and other observations) from previous interviews were mapped onto the SEM.
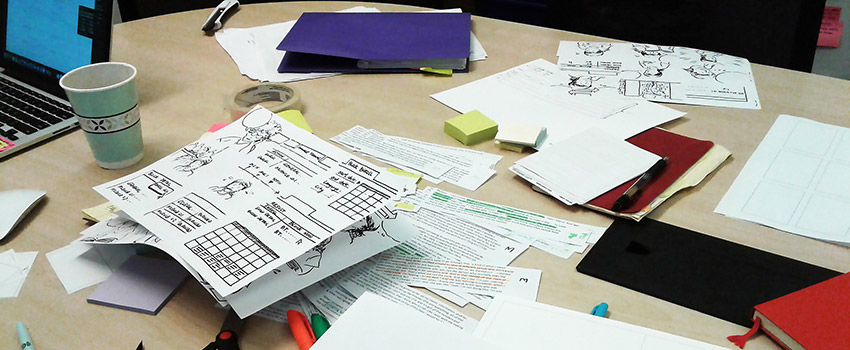
STORYBOARDING
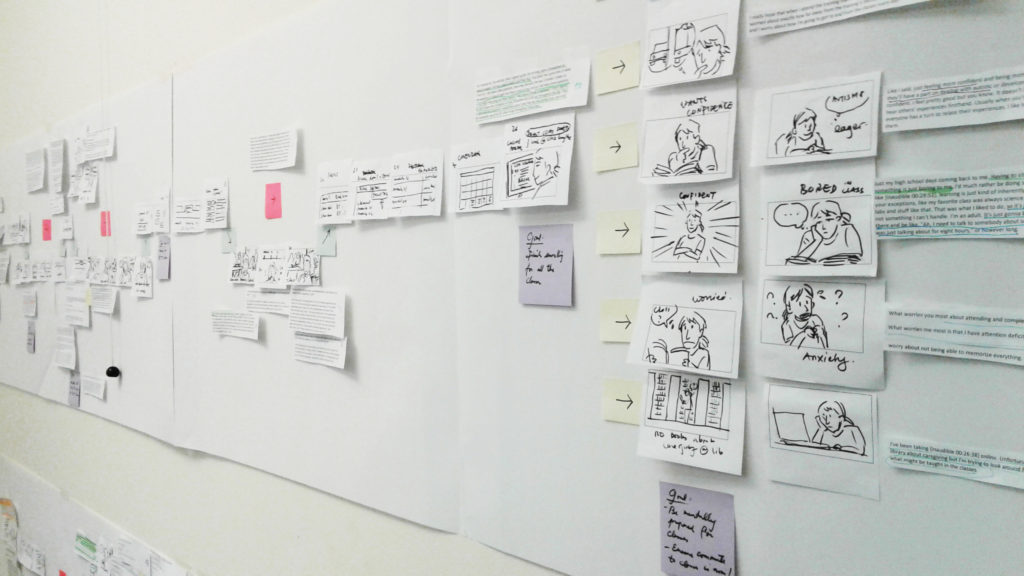
While it is a hard work, when done correctly, storyboarding can be a great tool to help with analyzing and synthesizing data. Furthermore, storyboards help constraint the scope of a narrative, which made it more accessible for the audience to focus on the main takeaways of a user journey.
STORYBOARD + JOURNEY MAP
The early step of understanding caregiver on-boarding experience was to create a simple journey map utilizing the storyboards created as the main narrative of caregiver journey. Included in the journey map were other pain points, challenges, and user experiences (thinking + feeling).
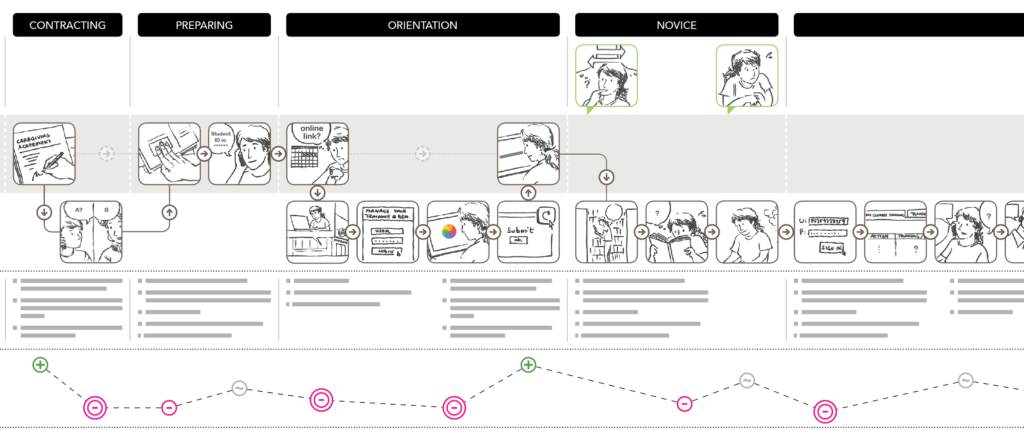
STORYBOARD + SYSTEM EVENT MAP
On top of journey mapping, the storyboard (specifically on caregiver pain points) can also be mapped onto the SEM to indicate what the barriers and challenges caused by specific processes and mechanisms. This was the area where technical-oriented audience found to be very useful, as it not only showed areas with specific problems, but it could be immediately diagnosed by what mechanisms that caused them.
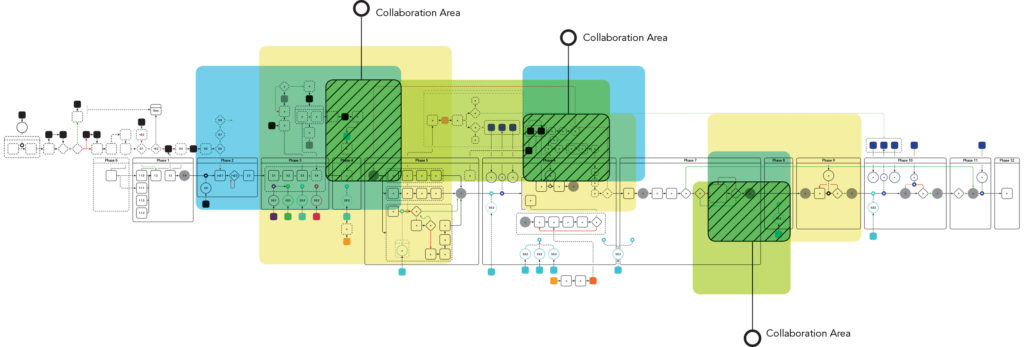
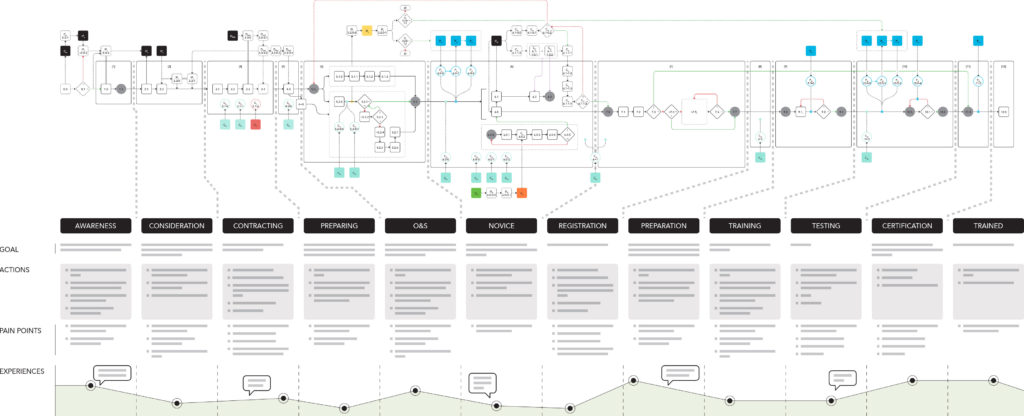
A (MORE) COMPREHENSIVE SYSTEM
Eventually, a combination of SEM and journey map was developed. When the SEM and journey map were combined, it created a more comprehensive system that serves various stakeholders, for both strategists and engineers, for example. In fact, such map help various teams be able to collaborate more meaningfully.
RESULTS
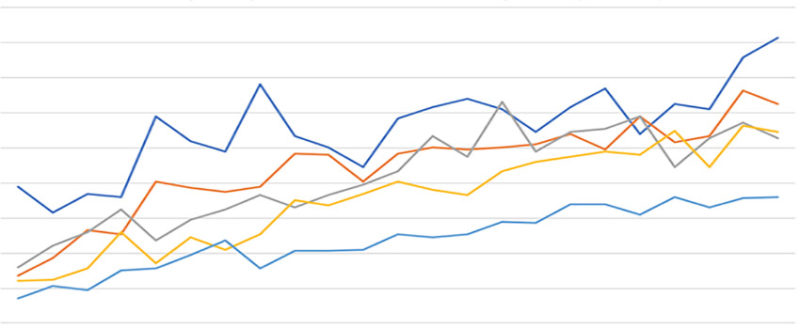
The result of developing SEM has had positive impacts to the organization. For one, the when various teams review the SEM, they discovered that there had been multiple pilots and interventions that were trying to solve the same problem without being consistent. For other, since its initial inception, other versions of SEM have been requested by various departments to serve different purposes.
REFLECTIONS
1. One of the problems with SEM is the issue of scalability — specifically introducing SEM for others in a way where other people could develop their own. One barrier could be lack of access to software, or skills to use it. However, I found that people might be overwhelmed by the complexity of the built SEM (I would too) and thus would prefer seeking counsel than creating on their own. However, I also found that through collaboration, and presenting the build up of the SEM from a very simple start through each iteration, stakeholders often are pleasantly surprise by the end result.